
Countries with the most freshwater
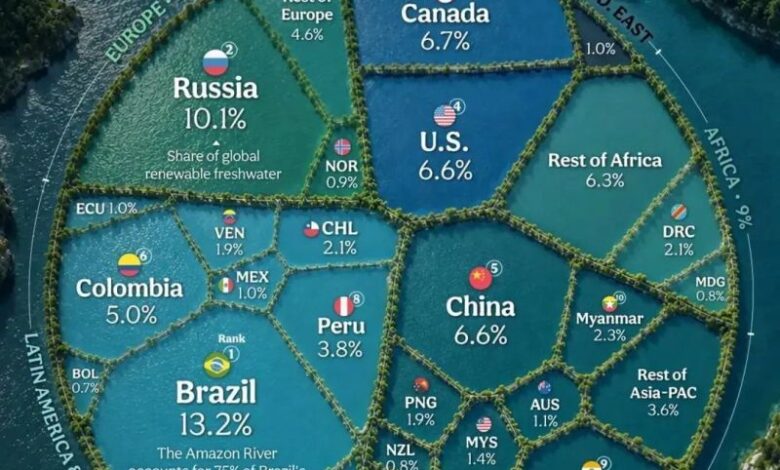
Global Freshwater Distribution
While 71% of Earth’s surface is covered by water, only 2.5% is freshwater and less than 1% of that is readily accessible in lakes, rivers, and shallow aquifers. Renewable freshwater resources are concentrated in a small number of geographic giants:
| Country | Global Share (%) | Primary Water Systems |
| Brazil | 13.2% | Amazon River Basin, Guarani Aquifer |
| Russia | 10.1% | Lake Baikal, Volga & Siberian River Systems |
| Canada | 6.7% | Great Lakes System, Glacial Basins |
| United States | 6.6% | Mississippi-Missouri Basin, Great Lakes |
| China | 6.6% | Yangtze & Yellow River Basins |
The Gap Between Abundance and Water Security
Having vast freshwater reserves does not guarantee local supply stability. Freshwater abundance does not equal water security. A nation can hold huge renewable reserves yet experience severe water stress due to six primary drivers:
- Geographic Mismatch: Resources are often located far from major population centers (e.g., Canada’s northern rivers or Russia’s Siberian basins vs. their urban populations).
- Infrastructure Deficits: Lacking storage, treatment, and distribution networks prevents raw freshwater from reaching households or industry safely.
- Agricultural & Industrial Strain: Over-extraction for irrigation and heavy manufacturing depletes groundwater tables faster than natural recharge rates.
- Pollution & Degradation: Industrial runoff, untreated sewage, and agricultural chemicals render large volumes of surface water unsafe without costly treatment.
- Climate Volatility: Shifting rainfall patterns, prolonged droughts, and accelerated glacial retreat alter predictable seasonal flows.
- Arid Baseline Realities: Regions like the Middle East face natural geographic limits, forcing heavy reliance on energy-intensive desalination and wastewater recycling.
Key Shift: Sustainable water management requires moving from tracking volume consumed to measuring system resilience the capacity of infrastructure and ecosystems to withstand climate shocks, population growth, and contamination.
Urban Microclimates: What Makes a City Hotter or Cooler?
Cities do not experience temperature uniformly; urban design and surface materials directly dictate local thermal conditions through the Urban Heat Island (UHI) effect.
Hotter City Drivers                     Cooler City Drivers
-------------------                     -------------------
• Dark asphalt & concrete (Low Albedo)  • High vegetation cover (Evapotranspiration)
• Trapped waste heat (Cars, AC units)   • Water bodies & cooling corridors
• Tall buildings blocking wind flow     • Reflective/Light surfaces (High Albedo)
Factors That Increase Urban Heat
- Low Albedo Materials: Dark asphalt, tar roofs, and concrete absorb shortwave solar radiation during the day and re-radiate it as thermal energy at night.
- Anthropogenic Waste Heat: High concentrations of vehicles, industrial activity, and air conditioning units exhaust heat directly into the ambient outdoor air.
- Urban Canyon Effect: Tall, densely packed structures trap radiation between buildings and reduce natural wind ventilation that would otherwise disperse heat.
Factors That Cool Cities
- Evapotranspiration: Trees, parks, and green roofs absorb water through roots and release it as vapor, directly lowering surrounding air temperatures.
- High Albedo Infrastructure: Light-colored pavements, cool roofs, and reflective building materials bounce solar radiation back into space before it converts into heat.
- Blue Infrastructure: Urban lakes, rivers, canals, and fountains act as heat sinks and promote localized cooling breezes.


