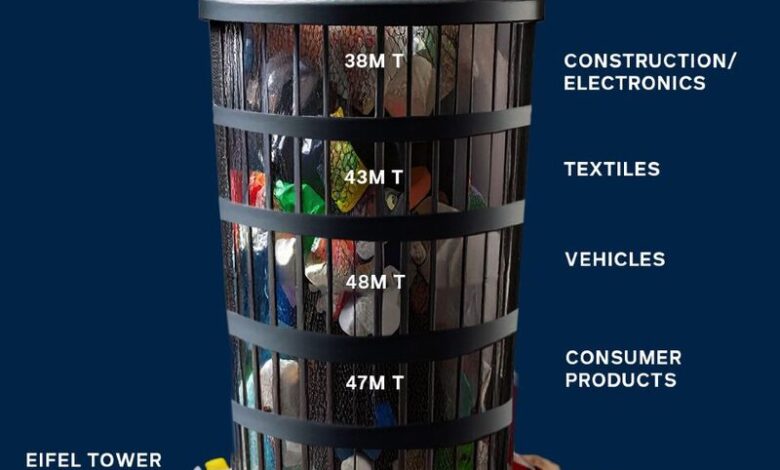
One years of plastic waste
Redesigning Supply Chains for a Circular Economy
The global plastic crisis is frequently framed as a failure of municipal waste management. However, empirical material flow analyses reveal a different reality: the crisis is fundamentally an upstream engineering, design, and business model flaw.
Every year, humanity generates over 400 million metric tons of plastic waste. Understanding where this material originates and why standard recycling mechanisms fail to address it is essential to building a functional circular economy.
1. Material Flow Breakdown: The Packaging Dominance
While consumer electronics, automotive components, and synthetic textiles contribute significantly to global polymer consumption, single-use packaging represents the single largest sector of plastic waste generation globally.
[Global Plastic Waste Generation by Sector]
  █ Packaging (Single-Use): ~36–40%  (Shortest lifecycle: minutes to days)
  █ Building & Construction: ~16%   (Long lifecycle: decades)
  █ Textiles: ~14%
  █ Consumer Products & Electronics: ~10%
  █ Automotive & Transportation: ~7%
  █ Other Sectors: ~13%
The fundamental discrepancy lies in the lifecycle-to-permanence ratio: packaging materials are engineered for maximum durability using non-biodegradable polymers (e.g., PET, HDPE, LDPE, PP), yet they are deployed for single-use applications lasting only minutes or hours before disposal.
2. Upstream Material Design: The Four Pillars of Circular Packaging
Downstream interventions—such as mechanical recycling or waste-to-energy (PSEL/incineration) are insufficient on their own to manage total volume. Solving the crisis requires embedding circular design principles at the engineering stage:
| Design Pillar | Technical Mechanism | Strategic Impact |
| Refill & Reuse Systems | Standardized container geometries designed for high-cycle washing and return logistics. | Eliminates virgin resin production and reduces per-use carbon footprint by up to 80%. |
| Closed-Loop Recyclability | Mono-material packaging designs (e.g., pure PP or pure PET) avoiding unseparable multi-layer laminates. | Prevents downcycling into lower-grade applications and preserves polymer chain length. |
| Certified Industrial Composting | Bio-based polymers (e.g., PLA, PHA) specified for organic-contaminated packaging (food service). | Diverts organic waste from landfills while returning nutrients to biological cycles via industrial composting. |
| Recycled Content Integration | Incorporating high percentages of Post-Consumer Recycled (PCR) resin into new packaging. | Drives market demand for recycled feedstock, stabilizing pricing and collection infrastructure. |
3. Systems Policy and Economic Drivers
Redesigning products at scale requires synchronized policy mechanisms that shift financial accountability back to producers while encouraging market innovation:
- Extended Producer Responsibility (EPR): Policy frameworks that mandate producers pay eco-modulated fees based on the recyclability and environmental impact of their packaging materials.
- Virgin Polymer Taxes: Economic levers designed to bridge the price gap between low-cost virgin fossil resins and post-consumer recycled (PCR) materials.
- Standardization and Phase-Outs: Legislative bans targeting high-leakage, hard-to-recycle items (e.g., expanded polystyrene, thin-film carrier bags, unattached bottle caps).
4. The Upstream Priority: Eliminating Waste by Design
Relying exclusively on consumer-side recycling places the burden at the end of the linear supply chain (Take-Make-Waste). Achieving structural change requires shifting focus upstream:
[Linear Model (Downstream Burden)]
Extraction ──► Manufacturing ──► Use ──► Waste Generation ──► Recycling / Landfill / Leakage

[Circular System (Upstream Prevention)]
Redesign / Eliminate ──► Reuse / Refill Systems ──► Mono-Material Recovery ──► Closed-Loop Feedstock
The transition to a circular plastics economy is not merely an environmental imperative it represents an industrial redesign challenge that replaces end of pipe waste management with systemic resource efficiency.
source:
https://www.linkedin.com/feed/update/urn:li:activity:7486335592037896193/