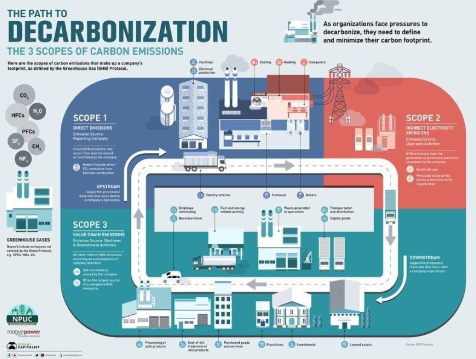
𝐓𝐡𝐞 𝐏𝐚𝐭𝐡 𝐭𝐨 𝐃𝐞𝐜𝐚𝐫𝐛𝐨𝐧𝐢𝐳𝐚𝐭𝐢𝐨𝐧: 𝐓𝐡𝐞 3 𝐒𝐜𝐨𝐩𝐞𝐬 𝐨𝐟 𝐂𝐚𝐫𝐛𝐨𝐧 𝐄𝐦𝐢𝐬𝐬𝐢𝐨𝐧𝐬
Credits to Visual Capitalist & Mohamed M. El-Haddad. Follow them for more sustainability insights.
Original post:
__________
Tagar#Sharing This infographic by 𝐕𝐢𝐬𝐮𝐚𝐥 𝐂𝐚𝐩𝐢𝐭𝐚𝐥𝐢𝐬𝐭 titled “𝐓𝐡𝐞 𝐏𝐚𝐭𝐡 𝐭𝐨 𝐃𝐞𝐜𝐚𝐫𝐛𝐨𝐧𝐢𝐳𝐚𝐭𝐢𝐨𝐧: 𝐓𝐡𝐞 3 𝐒𝐜𝐨𝐩𝐞𝐬 𝐨𝐟 𝐂𝐚𝐫𝐛𝐨𝐧 𝐄𝐦𝐢𝐬𝐬𝐢𝐨𝐧𝐬” as defined by the Greenhouse Gas (GHG) Protocol.
𝘚𝘤𝘰𝘱𝘦 1: 𝘋𝘪𝘳𝘦𝘤𝘵 𝘌𝘮𝘪𝘴𝘴𝘪𝘰𝘯𝘴
𝐄𝐦𝐢𝐬𝐬𝐢𝐨𝐧 𝐬𝐨𝐮𝐫𝐜𝐞𝐬: 𝐑𝐞𝐩𝐨𝐫𝐭𝐢𝐧𝐠 𝐂𝐨𝐦𝐩𝐚𝐧𝐲.
– Direct GHG emissions from sources owned or controlled by the company.
– Includes direct combustion emissions from biomass combustion.
– Depicted as emissions from facilities, chemical production, cooling, heating, computers, and vehicles.
𝘚𝘤𝘰𝘱𝘦 2: 𝘐𝘯𝘥𝘪𝘳𝘦𝘤𝘵 𝘌𝘭𝘦𝘤𝘵𝘳𝘪𝘤𝘪𝘵𝘺 𝘌𝘮𝘪𝘴𝘴𝘪𝘰𝘯𝘴
𝐄𝐦𝐢𝐬𝐬𝐢𝐨𝐧 𝐬𝐨𝐮𝐫𝐜𝐞𝐬: 𝐈𝐧𝐝𝐢𝐫𝐞𝐜𝐭—𝐔𝐩𝐬𝐭𝐫𝐞𝐚𝐦 𝐀𝐜𝐭𝐢𝐯𝐢𝐭𝐢𝐞𝐬.
– GHG emissions from the generation of purchased electricity consumed by the company.
– Electricity use occurs where the electricity is physically generated.
𝘚𝘤𝘰𝘱𝘦 3: 𝘝𝘢𝘭𝘶𝘦 𝘊𝘩𝘢𝘪𝘯 𝘌𝘮𝘪𝘴𝘴𝘪𝘰𝘯𝘴
𝐄𝐦𝐢𝐬𝐬𝐢𝐨𝐧 𝐬𝐨𝐮𝐫𝐜𝐞𝐬: 𝐕𝐚𝐥𝐮𝐞 𝐂𝐡𝐚𝐢𝐧—𝐔𝐩𝐬𝐭𝐫𝐞𝐚𝐦 & 𝐃𝐨𝐰𝐧𝐬𝐭𝐫𝐞𝐚𝐦 𝐀𝐜𝐭𝐢𝐯𝐢𝐭𝐢𝐞𝐬.
– All other indirect GHG emissions occurring as a consequence of a company’s activities.
– Not controlled or owned by the company.
– Often the largest source of a company’s GHG emissions.
– Includes employee commuting, business travel, upstream and downstream transportation, waste generated in operations, processing of sold products, and end-of-life treatment of sold products, among others.
The infographic stresses that organizations need to define and minimize their carbon footprint to face pressures to decarbonize. It features various sources of greenhouse gases such as CO₂, HFCs, N₂O, PFCs, SF₆, CH₄, NF₃ and notes that the Kyoto Protocol does not include emissions such as CFCs, NOx, etc.
🔗 𝐒𝐨𝐮𝐫𝐜𝐞: 𝐆𝐇𝐆 𝐏𝐫𝐨𝐭𝐨𝐜𝐨𝐥, 𝐌𝐨𝐭𝐢𝐯𝐞 𝐏𝐨𝐰𝐞𝐫 & 𝐍𝐏𝐔𝐂.
__________
♻️ Find this post useful? Feel free to share it with your network 📣
Source:
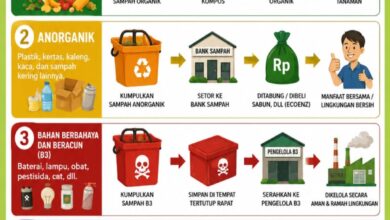
Temukan peta dengan kualitas terbaik untuk gambar peta indonesia lengkap dengan provinsi.