Understanding scope 1, 2, 3, and scope 4 emissions
Buzzwords: The Strategic Reality of Scope 1, 2, 3, and 4 Emissions
When an organization proudly announces a “Net Zero by 2030” target, a crucial question usually goes unasked: Which emissions are they actually talking about?
In sustainability, intent is great, but boundaries are everything. If a company claims it is carbon neutral because its head office uses solar panels, but its global supply chain relies on coal-powered factories, that “Net Zero” claim is functionally a mirage.
To build a climate strategy that survives regulatory scrutiny and avoids greenwashing, you have to understand the full carbon story across four distinct dimensions.
The Three Core Scopes (The Mandatory Accounting)
Established by the Greenhouse Gas (GHG) Protocol, Scopes 1, 2, and 3 are the legal and accounting bedrock of corporate carbon footprints.
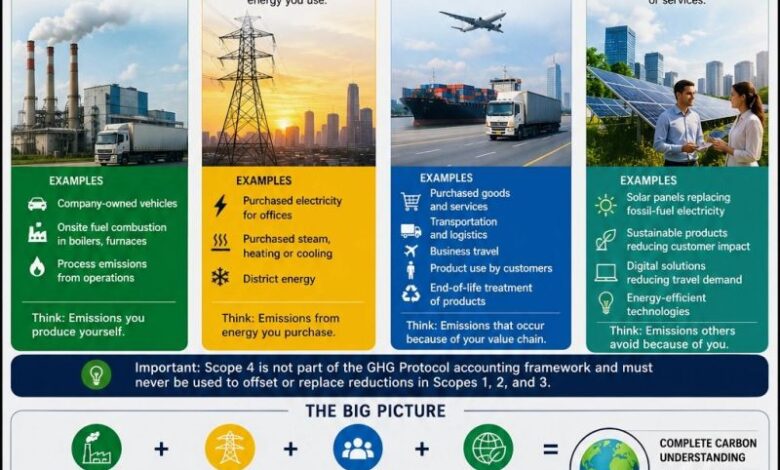
Scope 1: Direct Ownership (The Tailpipes and Smokestacks)
Scope 1 covers the emissions that your organization directly generates through assets it physically owns or controls.
- The Reality: If your company burns it, you own it.
- Key Drivers: Fleet vehicles burning gasoline, gas-fired office boilers, or heavy machinery inside your factories.
- The Strategic Fix: Hard electrification—switching fleets to EVs and replacing fossil-fuel heating systems with heat pumps.
Scope 2: Purchased Energy (The Invisible Cord)
Scope 2 captures the indirect emissions from the energy you buy to power your operations. While the carbon is physically emitted at a power plant miles away, your demand is what pulled it into the atmosphere.
- The Reality: If you plug it in, it’s Scope 2.
- Key Drivers: The electricity keeping your data centers cool, your office lights on, or your manufacturing lines running.
- The Strategic Fix: Transitioning to Power Purchase Agreements (PPAs) for renewable energy or installing on-site solar.
Scope 3: The Value Chain (The Hidden 90%)
Scope 3 encompasses all other indirect emissions that occur up and down your entire value chain. It includes everything from the raw materials you buy to how customers eventually throw your product away.
- The Reality: For most companies, Scope 3 accounts for 70% to 90% of their total footprint, yet it is the hardest to measure and manage because you don’t control the data.
- Key Drivers:
- Upstream: Employee commuting, business travel, and the carbon footprint of your suppliers.
- Downstream: The electricity your customers consume when using your products, and the logistics of shipping goods globally.
- The Strategic Fix: Supplier code-of-conduct mandates, designing products for a circular economy, and localizing supply chains.
Scope 4: Avoided Emissions (The Innovation Narrative)
Scope 4 sits outside the official GHG Protocol accounting framework, but it is becoming the most critical metric for forward-thinking companies. It measures the emissions saved outside your value chain because your product or service replaced a higher-emitting alternative.
The Golden Rule of Scope 4: Avoided emissions are a measure of positive impact, not an accounting trick. A company cannot use Scope 4 “savings” to mathematically offset or hide poor performance in Scopes 1, 2, or 3.
- The Example: If an engineering firm develops a hyper-efficient smart thermostat, the energy saved by millions of households is a Scope 4 win. However, the firm must still reduce the actual emissions from its own offices (Scope 2) and electronic manufacturing partners (Scope 3).
Visualizing the Impact: The Carbon Profile Simulator
Because every industry operates differently, a “one-size-fits-all” approach to Net Zero doesn’t work. A software company has a fundamentally different carbon DNA than a heavy manufacturing plant.
Use the interactive simulator below to see how different business models shift the weight of responsibility across the four scopes, and explore where the highest-leverage climate actions actually sit.
source:
https://www.linkedin.com/feed/update/urn:li:groupPost:2474261-7476574111419445248/
Temukan peta dengan kualitas terbaik untuk gambar peta indonesia lengkap dengan provinsi.