Carbon neutral goals by country: visualizing commitments in the climate crisis
As the urgency to combat climate change intensifies, understanding the scale of global carbon emissions and the efforts to neutralize them becomes vital. An insightful infographic, shared by Charles Berville, offers a compelling visual representation of the ambitions and actions of nations worldwide to achieve carbon neutrality.
This infographic doesn’t just display data—it tells a story of ambition, disparity, and the immense task ahead. Let’s explore how it brings the climate crisis into focus and what it reveals about our collective journey toward a sustainable future.
The Weight of Carbon Emissions
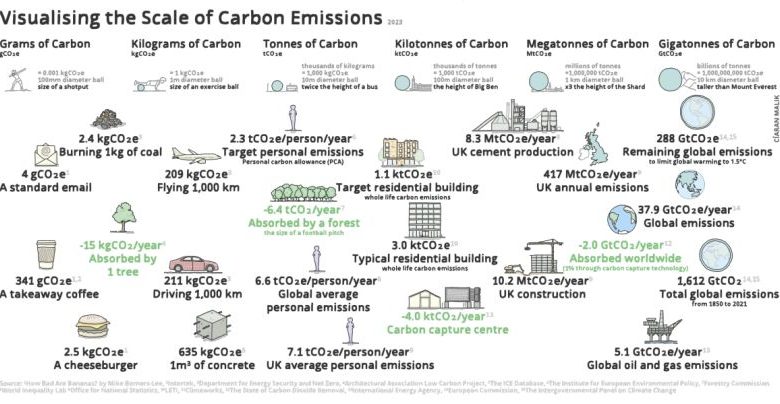
The infographic goes beyond listing goals; it visualizes the scale of emissions, illustrating not just which countries are pledging to act, but also the magnitude of their contributions to the climate crisis. From towering emitters to smaller, yet impactful players, the graphic invites viewers to grasp the disparities in responsibility and action.
Commitments Across the Globe
Countries have made varying commitments, showcasing a spectrum of ambition:
- Trailblazers: Nations like Sweden, with its legally binding 2045 goal, lead the way with clear and actionable plans.
- Pioneers in Practice: Bhutan and Suriname stand out as carbon-negative nations, demonstrating that sustainability is not just a goal but a reality.
Other nations, such as Uruguay, are exploring bold targets like achieving carbon neutrality as early as 2030, while China and the United States, as major emitters, are pivotal in shaping global outcomes with their respective 2060 and 2050 targets.
A Critical Eye on Gaps
The visualization also sheds light on nations still lagging in firm commitments or lacking clear timelines. This absence underscores the need for urgency, accountability, and international collaboration.
- Australia and Singapore: While net-zero goals have been announced, specifics remain ambiguous, leaving room for improvement.
- Brazil: Its 2065 target is seen as distant for a country with critical ecosystems like the Amazon rainforest.
Why This Matters
Seeing emissions visualized brings home the scale of the challenge. Each country’s share of emissions and their pledges highlight the interconnected nature of climate action. For some, the infographic might provoke pride in progress; for others, it could serve as a wake-up call.
What remains clear is that achieving net-zero emissions is not just about setting a year—it’s about taking bold, immediate actions to transition economies, protect ecosystems, and innovate sustainably.
This infographic is more than an artistic depiction of climate goals; it’s a rallying cry. It urges governments, businesses, and individuals to recognize their role in the race to net zero and to act with the urgency this moment demands.
In the end, this visualization does more than inform—it inspires. Because the journey to carbon neutrality isn’t just about data or targets; it’s about shaping a world where future generations can thrive. Let it fuel your resolve to push for meaningful change—together, we can turn ambitions into achievements.
source :
Temukan peta dengan kualitas terbaik untuk gambar peta indonesia lengkap dengan provinsi.