GHG Accounting
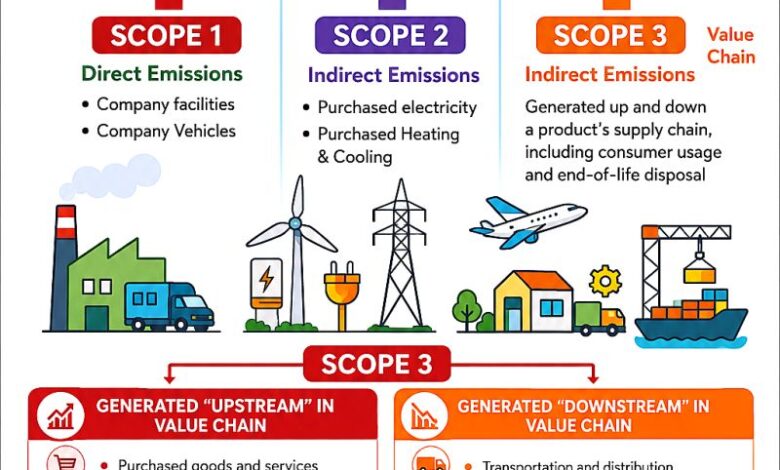
Greenhouse Gas (GHG) Accounting: Demystifying Scope 1, Scope 2, and Scope 3 Emissions
Greenhouse Gas (GHG) accounting commonly referred to as a Carbon Footprint Assessment is the standardized framework organizations use to quantify, track, and report their climate impact. Codified by the GHG Protocol (developed by the World Resources Institute and WBCSD) and ISO 14064, GHG accounting classifies emissions into three distinct operational boundaries: Scope 1, Scope 2, and Scope 3.
Understanding these boundaries is mandatory for corporate ESG disclosures, climate risk assessments, and setting science-based targets (e.g., SBTi).
1. The Three Scopes Breakdown
                            [GHG PROTOCOL SCOPES]
                                      │
   ┌──────────────────────────────────┼──────────────────────────────────┐
   ▼                                  ▼                                  ▼
[SCOPE 1: Direct]           [SCOPE 2: Indirect Energy]          [SCOPE 3: Value Chain]
Controlled Assets           Purchased Utilities                 Upstream & Downstream
(On-site fuels, fleet)      (Electricity, steam, cooling)       (15 Categories)
Scope 1: Direct Operational Emissions
Emissions originating from sources owned or directly controlled by the reporting organization.
- Stationary Combustion: Fuel burned in boilers, furnaces, turbines, or back-up diesel generators.
- Mobile Combustion: Gasoline or diesel consumed by company-owned or leased vehicles (fleet cars, delivery trucks).
- Fugitive Emissions: HFC/CFC refrigerant leaks from air conditioning units, chillers, and industrial refrigeration systems.
- Process Emissions: Chemical releases from industrial processes (e.g., CO₂ released during cement manufacturing or chemical synthesis).
Scope 2: Indirect Energy Emissions
Emissions generated from the production of purchased or acquired energy consumed by the organization.
- Purchased Electricity: Grid electricity used for lighting, machinery, equipment, and server rooms.
- Purchased Thermal Energy: District heating, steam, and chilled water.
- Accounting Approaches:
- Location-based: Reflects average emission intensity of the local grid where energy is consumed.
- Market-based: Reflects emissions based on specific contractual instruments (e.g., Renewable Energy Certificates [RECs] or Power Purchase Agreements [PPAs]).
Scope 3: Indirect Value Chain Emissions
All other indirect emissions occurring across the organization’s broader value chain both upstream (suppliers) and downstream (customers). Scope 3 is divided into 15 standardized categories:
| Boundary | Category | Key Emission Drivers |
| Upstream | 1. Purchased Goods & Services | Raw material extraction, agricultural inputs, and third-party manufacturing (cradle-to-gate). |
| 2. Capital Goods | Production of long-term physical assets (buildings, machinery, IT infrastructure). | |
| 3. Fuel & Energy Activities | Extraction, refining, and transport of fuels consumed in Scopes 1 & 2 (well-to-tank). | |
| 4. Upstream Transportation | Freight shipping and warehousing paid for by the reporting company. | |
| 5. Waste Generated in Operations | Disposal and treatment of operational solid waste and wastewater. | |
| 6. Business Travel | Commercial flights, rail journeys, rental cars, and hotel stays by employees. | |
| 7. Employee Commuting | Transportation of employees between home and work (including remote work energy). | |
| 8. Upstream Leased Assets | Leased facilities not included in Scope 1 or 2 reporting boundaries. | |
| Downstream | 9. Downstream Transportation | Logistics and freight outbound to customers paid for by third parties. |
| 10. Processing of Sold Products | Further refining or transformation of intermediate goods by third-party manufacturers. | |
| 11. Use Phase of Sold Products | Energy consumed by end-users operating the company’s products over their lifespan. | |
| 12. End-of-Life Treatment | Landfill, incineration, or recycling of sold products after consumer disposal. | |
| 13. Downstream Leased Assets | Assets owned by the reporting company but leased out to external parties. | |
| 14. Franchises | Operations of third-party franchisees under the reporting brand. | |
| 15. Investments | Financed emissions associated with equity/debt investments, lending, and underwriting. |
2. Why Scope 3 is the Strategic Bottleneck
For the vast majority of sectors (excluding energy producers and utilities), Scope 3 accounts for 80% to 95% of total carbon footprint impact.
Typical Corporate Footprint Distribution:
Scope 1 & 2: █ 10-20% (Operational Control)
Scope 3:     ████████████████ 80-90% (Value Chain Interdependence)
Strategic Challenges of Scope 3:
- Data Transparency & Primary Data Deficit: Scope 1 and 2 rely on utility bills and fuel meters. Scope 3 relies on supply chain data (spend-based estimates vs. supplier-specific activity data).
- Double Counting Risks: One company’s Scope 3 downstream emission is another company’s Scope 1 direct emission.
- Leverage Constraints: Influencing supplier raw material choices or consumer product habits requires business model innovation, eco-design, and circular economy strategies rather than simple facility retrofits.
3. The Business & Regulatory Imperative
Carbon accounting has evolved from a voluntary corporate social responsibility (CSR) exercise into a core financial and regulatory compliance requirement:
- Regulatory Mandates: Frameworks such as the EU’s CSRD (Corporate Sustainability Reporting Directive), the US SEC Climate Disclosures, and IFRS S2 mandate rigorous disclosure of Scope 1, 2, and material Scope 3 emissions.
- Access to Capital: Institutional investors and banks utilize Scope 1-3 metrics to price climate risk into debt and equity underwriting.
- Decarbonization Roadmap: Comprehensive GHG accounting enables organizations to move beyond incremental reductions to true Net-Zero alignment, identifying carbon hotspots across raw material sourcing, operational efficiency, and product design.
source: