Reducing climate change impacts on walking and cycling
In response to the climate emergency, cities around the world are already implementing ambitious actions to reduce emissions (mitigation), alongside efforts to increase their climate resilience (adaptation). These measures are put in place to protect citizens and infrastructure against current and future extreme weather events. Of C40 cities, 97% are already experiencing the effects of climate breakdown. The main climate hazards cities are reporting include storm and wind, flooding, sea level rise, extreme cold, extreme heat, drought and landslide.
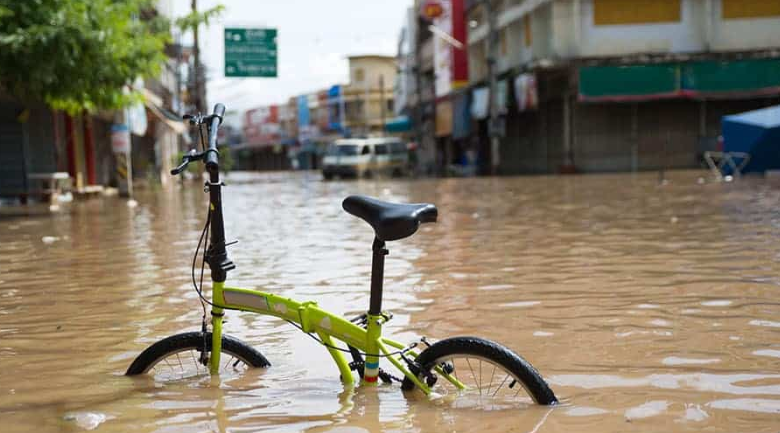
An efficient and reliable transport network plays a critical role in terms of access to education, employment and essential services. At the same time, urban transportation systems can be highly vulnerable to extreme weather events, which are predicted to increase in intensity and frequency with global climate change. It is therefore crucial that the investments cities make in the transition towards zero carbon are resilient to current and future climate scenarios and the inevitable increased occurrences in extreme weather events.
What does climate change mean for walking and cycling?
Having more and better walking and cycling infrastructure in cities is key to mitigating against climate breakdown. City planners have the responsibility to plan, develop and organise urban spaces that strive for zero carbon AND are resilient to changing climate impacts. Collaboration between transport planners and climate adaptation or resilience teams in each city is important to ensure that walking and cycling projects are adapted for climate breakdown and are resilient during extreme weather events.
Walking and cycling are attractive alternatives to motorised vehicles as they provide a reliable, low cost travel option when other transport infrastructures fail. For example, if a city’s Bus Rapid Transit or metro system fail due to flooding, landslides or a power outage, high quality walking (i.e. on water-permeable surfaces) and cycling (i.e. on protected routes) infrastructure is in itself a way to adapt to these events.
With rising global temperatures, walking and cycling infrastructure also needs to be adapted to changing local climatic conditions. Creating comfortable outdoor environments for pedestrians and cyclists – for example with increased shading and greenery – is crucial in order to avoid increased uptake and use of air-conditioned private vehicles.
Integrating climate adaptation in walking and cycling projects ideally starts at the planning stage of each project. Once climate risks are identified, suitable adaptation actions need to be put in place and monitored hand-in-hand with the walking and cycling project. If adaptation measures are not considered at the first stages of a project plan, they can also be added to already existing infrastructure and schemes.
Improving the infrastructure of walking and cycling projects means that citizens continue their healthy, safe and carbon-free mobility while also providing adapted and resilient options.
Examples of climate change adaptation measures integrated with walking and cycling
Flooding
- Improve drainage infrastructure to be able to deal with more intense rainfall events and prevent flooding.
- Install signs high-above the ground that can alert pedestrians and cyclists of unsafe zones.
- Improve green spaces for water permeability and flood protection.
- Consider the use of porous pavements for pedestrianized areas, cycling routes, cycle hire stations.
- Elevate infrastructure in flood prone areas.
- Avoid implementing pedestrianized areas, cycling routes, and cycle hire stations in areas prone to extreme flooding. Use city’s risk assessment plans for modelling flood risks & identify alternative lanes, stations and areas.
- Make electrical infrastructure for cycle hire stations flood proof.
Extreme heat
- Increase greenery of pedestrianised areas, cycling lanes and cycle hire stations to decrease outdoor temperatures.
- Install drinking fountains next to cycle hire stations, along bike lanes and in pedestrianized areas.
- Shade areas next to cycle hire stations and in pedestrianized zones to decrease exposure to heat.
- Increased maintenance of asphalt to avoid corrosion from heat.
- Consider the use of higher solar reflectance and/ or cool/ permeable pavements in pedestrianized areas, cycling lanes and cycle hire stations.
- Design cycling routes through parks to provide cooling.
- Install green roofs in proximity to pedestrianized areas, cycling lanes and cycle hire stations to provide cooling.
Sea level rise
- Create vulnerability maps to identify areas at most risk.
- Install high-quality, low-cost walking and cycling infrastructure along high-risk shorelines to act as barriers that reduce damage to developments in case of storms.
- Improve drainage, pumping of underpasses.
- Elevate existing pedestrianized areas, cycling lanes and cycle hire stations in high-risk areas.
- Install backup power for e-bike hires.
Drought
- Assess the likeliness of impacts on bike lanes and pedestrianized infrastructure (risk mapping) and avoid new developments in high-risk areas.
- Monitor soil conditions of existing roads and pedestrianized areas.
- Increase maintenance of asphalt in pedestrianized areas, cycling routes, cycle hire stations.
Extreme cold
- Provide city-led cycle training for winter conditions.
- Design shelters for public bike share.
- Prioritise road salt in pedestrianized areas, cycling routes and cycle hire stations.
- Prioritise to remove snow in pedestrianized areas, cycling routes and cycle hire stations.
- Educate citizens to change cycle tires for winter conditions.
Landslide
- Avoid pedestrianised areas, cycling lanes and cycle hire stations in landslide prone zones. Use cities’ risk assessment plan for modelling landslide risks and identify alternative lanes, stations and areas.
- Have (removable) barriers installed to protect walking & cycling routes from landslides.
C40’s Adaptation and Mitigation Interaction Assessment (AMIA) tool
To help cities understand the interactions and interdependencies associated with climate change adaptation and mitigation actions, C40 Cities produced the AMIA tool. The tool is designed to support city practitioners in climate action planning by mapping the synergy potential, trade-off potential, mal-investment risk and piggybacking opportunities of a wide range of actions, such as switching to electric buses and investing in building-scale solar energy. It also includes 60 case studies and examples of city initiatives that have aimed to maximise synergies and address interdependencies. You can download it and find out more about how it works here.
City Case Studies
Medellin’s green corridors
Medellin has created green corridors along 18 roads and 12 waterways. The city planted 8,300 trees and 350,000 shrubs. The Green Corridors provide shade to cyclists and pedestrians, cooling built up areas and cleaning the air along busy roads. The city’s botanical gardens train people from disadvantaged backgrounds to become city gardeners and planting technicians. Temperatures along the Avenue Oriental, one of the city’s main roads, have fallen by up to three degrees.
The programme is increasing active mobility, alongside boosting biodiversity and reducing the urban heat island effect. Through beautiful and functional greenery, the city is adapting to climate change and giving residents a better quality of life. The city has won several awards for this innovative solution, such as the Ashden Award 2019 for Cooling by Nature 2019 and C40 Bloomberg Awards 2019 for Resilience. Read more about it here.
Los Angeles’ Cool Seal Coating
Los Angeles updated its climate adaptation plan pledges to reduce temperatures in the city by 1.7°C by 2025, and 3°C by 2035. To do so, the city is increasing greenery, and also adding new cooling surfaces in several vulnerable neighbourhoods. A one-quarter millimetre layer of higher reflective coating that is applied to asphalt in the warmest areas of the city costs about $0.60 per square foot, and can reduce surface temperature by roughly 5.5C. The city is also testing cooling materials on bike lanes and is researching the neighbourhood-level cooling effect.
Hamburg bridging the flood
Hamburg is constructing new and upgrading existing bridges in response to potential future flooding events. The Kibbelstegbrücke bridge for example will provide a flood-secure connection between the dike-bound city centre and HafenCity.
Tel Aviv’s shading guidelines and competition
In response to extreme heat, Tel Aviv developed Shading Planning Guidelines that set out detailed municipal guidelines regarding the quantity and quality of shade (greening, fabric or structures) in the open public space. The document outlines the need to protect citizens from heat whilst providing innovative shade alternatives to public spaces.
In order to keep pedestrians and cyclists cool, the city also launched a shading competition in 2017, which was an urban initiative directed to architects, designers and more to create unique shade structures for Tel Aviv. The objective of the competition was to combine art and innovation to reduce the urban heat in the city.
Shanghai’s Sponge city
The Sponge City initiative was launched in China in 2015, to find ecological alternatives to flooding and sea level rise. Shanghai, one of the 30 cities piloting the project, use permeable pavements in their streets, allowing water to drain the soil. Central reservations are also used as rain gardens and are filled with soil and plants. The government has ambitious actions in place to expand the sponge areas of the city and combat extreme weather related events.
Source:
Temukan peta dengan kualitas terbaik untuk gambar peta indonesia lengkap dengan provinsi.