Understanding Urban Heat Islands with Google Earth Engine and QGIS: A Powerful Duo for Climate Analysis
Understanding Urban Heat Islands with Google Earth Engine and QGIS: A Powerful Duo for Climate Analysis 🌍
The Urban Heat Island (UHI) effect, where urban areas experience significantly higher temperatures than surrounding rural areas, is one of the most critical challenges of modern urbanization. This phenomenon intensifies energy demands, worsens air quality, and impacts public health—especially in a warming world. 🌡️
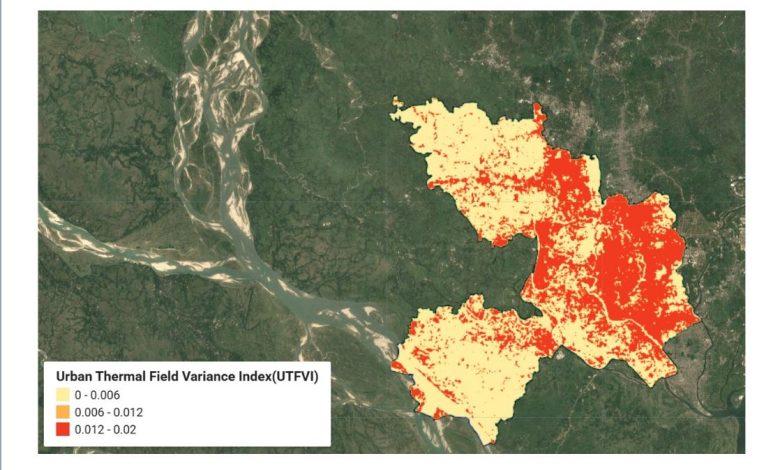
In addressing UHI, remote sensing and GIS tools have become indispensable. Today, I’d like to share insights into using Google Earth Engine (GEE) and QGIS to study Urban Heat Island effects and analyze the Urban Thermal Field Variance Index (UTFVI) at Tagar#DHAKA,Tagar#Bangladesh.
Grateful to Mirza Waleed for the inspiring Urban studies that drives my passion, and to Qiusheng Wu transformative tutorials and workshop that made geospatial analysis and machine learning feel truly accessible. Your innovative work fuels curiosity and empowers researchers to reimagine possibilities. 🌍✨
1️⃣ Urban Thermal Field Variance Index (UTFVI):
UTFVI provides a quantifiable approach to assess the thermal stress levels in urban areas by analyzing land surface temperature (LST) data. It’s categorized into six levels, from “No thermal stress” to “Extreme thermal stress,” offering a clear snapshot of urban thermal dynamics. 🌆🔥
This index helps urban planners and environmental scientists to:
>>Identify heat-vulnerable zones.
>>Guide green infrastructure development (urban forests, cool roofs).
>>Plan climate adaptation measures.
UTFVI ranges and their ecological evaluation
Less than zero: No UHI presence, excellent ecological evaluation.
0–0.005: Weak UHI presence, good ecological evaluation.
0.005–0.010: Middle UHI presence, normal ecological evaluation.
0.010–0.015: Strong UHI presence, bad ecological evaluation.
0.015–0.02: Stronger UHI presence, worse ecological evaluation.
Greater than 0.02: Strongest UHI presence, worst ecological evaluation.
2️⃣ Analyzing UHI and UTFVI with Google Earth Engine:
GEE simplifies UHI and UTFVI analysis to:
>>Access Tagar#Landsat imagery for Land Surface Temperature (LST) analysis.
Derive Normalized Difference Vegetation Index (NDVI) or Built-up Area Index to correlate land use with thermal variance.
3️⃣ Why This Matters:
>>Identifying Hotspots: GEE enabled us to pinpoint areas within the city experiencing the most intense UHI effects.
>>Quantifying Spatial Variability: UTFVI provided valuable insights into the spatial distribution of temperature variations across the urban landscape.
Implications:
>>Urban Planning: This research can inform urban planning strategies, such as the creation of green spaces and the implementation of cool roofs, to mitigate UHI effects.
>>Public Health: Understanding UHI can help assess heat-related health risks and inform public health interventions.