Carbon emmision: net zero frontiers
We often talk about “decarbonization” in broad strokes, but to genuinely confront the climate crisis, we need laser-sharp focus. Thanks to invaluable insights from Net Zero Frontiers, a stark reality comes into crystal-clear view and this chart, if you truly absorb it, speaks volumes.
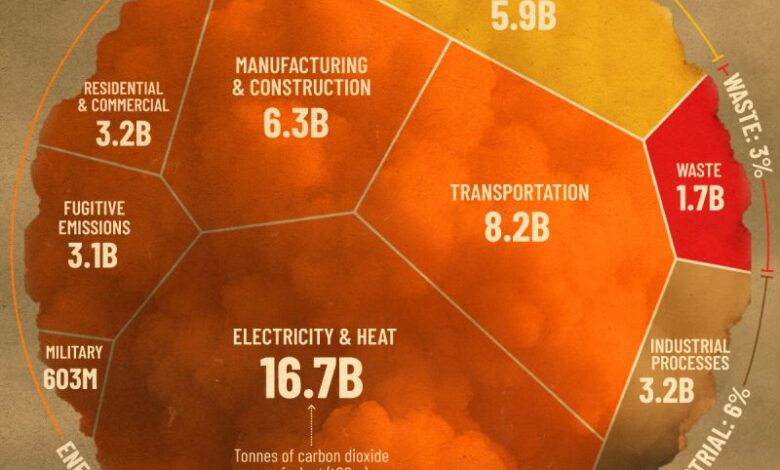
When we strip away the complexities and zoom in on the source, one sector dominates the global carbon footprint, demanding our undivided attention: ENERGY.
Yes, the way we power our world is not just a major contributor; it is the overwhelming force pushing us towards irreversible climate thresholds. Just the act of generating Electricity & Heat alone pumps out a staggering 16.7 billion tonnes of CO₂e into our atmosphere. Let that sink in: that’s over 43% of all global emissions from a single, critical domain.
This isn’t to diminish other vital areas of action, but to clarify the hierarchy of impact. Here’s the sobering breakdown of where the rest of our global carbon emissions originate:
- 🚗 Transportation: A significant 8.2 billion tonnes – the fuel powering our movements across land, sea, and air.
- 🏗️ Manufacturing & Construction: The very industries building our world contribute 6.3 billion tonnes.
- 🌾 Agriculture: Our food systems, from livestock to farming practices, account for 5.9 billion tonnes.
- 🏢 Residential & Commercial (Buildings): The energy consumed in our homes and offices adds 3.2 billion tonnes.
- ⚙️ Industrial Processes: Emissions from chemical reactions and industrial production, distinct from energy use, contribute 3.2 billion tonnes.
- 🐄 Fugitive Emissions: Unintended leaks, particularly of methane from oil, gas, and coal operations, amount to 3.1 billion tonnes – a potent and often overlooked threat.
- 🗑️ Waste: Landfills and waste treatment generate 1.7 billion tonnes.
- 🌲 Land Use Change & Forestry: Deforestation and changes in land management release 1.3 billion tonnes.
- 🪖 Military: A surprisingly impactful 603 million tonnes.
The message from these numbers is deafeningly clear: if we are to have any hope of hitting the ambitious, yet absolutely essential, Paris Agreement goals, then optimizing, electrifying, and comprehensively decarbonizing our energy systems must be the unequivocal top priority. This is the beating heart of the climate crisis, and it’s where our most fervent efforts must be concentrated.
Let’s shed any illusions of simplicity. The climate crisis is not a collection of isolated problems; it is a profound systems problem. And this stark, data-driven breakdown of emissions? This is not just a chart. This is our roadmap. It points directly to the leverage points, the critical interventions that will determine whether we secure a livable future or succumb to inertia. The time for focused, transformative action is now.
source:
Temukan peta dengan kualitas terbaik untuk gambar peta indonesia lengkap dengan provinsi.